RSS

The Evolution of Vancouver's Real Estate Market:

A Journey Through the Past Twenty Years

Vancouver, British Columbia, a bustling metropolis nestled between the picturesque Coast Mountains and the Pacific Ocean, has experienced a dramatic transformation in its real estate market over the past two decades. This email will take you on a journey through the key events and trends that have shaped Vancouver's real estate landscape since the turn of the century.

2000-2010: A Decade of Growth and Development
The new millennium marked the beginning of a period of rapid expansion in Vancouver's real estate market. The city's population increased by more than 20% between 2000 and 2010, fueled by immigration and the appeal of the city's natural beauty, mild climate, and economic opportunities.

Expo Line Extension and the 2010 Winter Olympics
Major infrastructure projects, such as the Expo Line SkyTrain extension to King George Station in 2000, played a significant role in shaping the city's real estate landscape. This expansion facilitated the development of new residential and commercial properties in the surrounding areas.

The announcement of Vancouver as the host city for the 2010 Winter Olympics also played a major role in the city's real estate boom. The event spurred significant investment in infrastructure and development projects, including the construction of the Canada Line, the Olympic Village, and the expansion of the Vancouver Convention Centre.

Foreign Investment and Rising Prices
During this decade, Vancouver's real estate market also began to attract significant foreign investment, particularly from wealthy Chinese buyers. This influx of capital contributed to the rapid increase in property prices, making Vancouver one of the most expensive cities in North America.

2010-2020: A Decade of Challenges and Change
The past decade has seen Vancouver's real estate market face a number of challenges, including skyrocketing prices, affordability concerns, and government intervention.

Soaring Prices and Affordability Crisis
The early 2010s saw Vancouver's real estate market continue to experience strong growth, with prices reaching record highs. However, this rapid increase in property values led to a growing affordability crisis, with many local residents struggling to enter the housing market.

Government Intervention: Foreign Buyers Tax and Empty Homes Tax
In response to the affordability crisis and concerns about foreign investment, the British Columbia government introduced a 15% foreign buyers tax in 2016. This tax, which was later increased to 20%, was aimed at cooling the market and improving affordability for local residents.

The City of Vancouver also implemented an Empty Homes Tax in 2017, targeting properties that were left vacant for more than six months of the year. This measure was designed to increase the availability of rental properties and encourage more efficient use of housing stock.

Market Slowdown and COVID-19 Pandemic
These government interventions, combined with tighter mortgage regulations and rising interest rates, contributed to a slowdown in Vancouver's real estate market in the latter half of the decade. The COVID-19 pandemic has also had a significant impact on the market, with sales activity and prices experiencing fluctuations as a result of economic uncertainty and public health measures.

Looking Ahead: The Future of Vancouver's Real Estate Market
As we move into the next decade, the future of Vancouver's real estate market remains uncertain. The ongoing affordability crisis, coupled with the potential for further government intervention and the long-term impacts of the COVID-19 pandemic, will continue to shape the market in the coming years.

However, Vancouver's enduring appeal as a place to live, work, and invest will likely ensure that its real estate market remains resilient and dynamic. As the city continues to evolve and adapt to new challenges, it will be fascinating to see what the future holds for Vancouver's real estate landscape.

Please feel free to call Billy at 778-836-3915 or reply to this email with any real estate questions or comments.

All the best,

Billy

Read


Vancouver, BC – December 12, 2017The British Columbia Real Estate Association (BCREA) reports that a total of 7,731 residential unit sales were recorded by the Multiple Listing Service® (MLS®) in November, an increase of 20.4 per cent from the same period last year. Total sales dollar volume was $5.59 billion, up 39.1 per cent from November 2016. The average MLS® residential price in the province was $723,112, up 15.5 per cent from November 2016.

“November was the third consecutive month that BC home sales were above 9,000 units, on a seasonally adjusted basis," said Cameron Muir, BCREA Chief Economist. "Elevated consumer demand is being supported by strong employment growth, rising wages and favourable demographics."

BC employment increased 3.8 per cent over the last 12 months, totaling over 90,000 jobs. Over the same period, average hourly wages in the province climbed 5.7 per cent to $26.82. Against this backdrop, a large cohort of millennials is entering their household-forming life stage. In addition, some buyers are likely completing purchases now in advance of tighter conventional mortgage qualifications, scheduled for the new year.

Year to date, BC residential sales dollar volume was down 6.8 per cent to $69.4 billion, when compared with the same period in 2016. Residential unit sales declined 8.8 per cent to 98,024 units, while the average MLS® residential price increased 2.2 per cent to $708,150.
Read

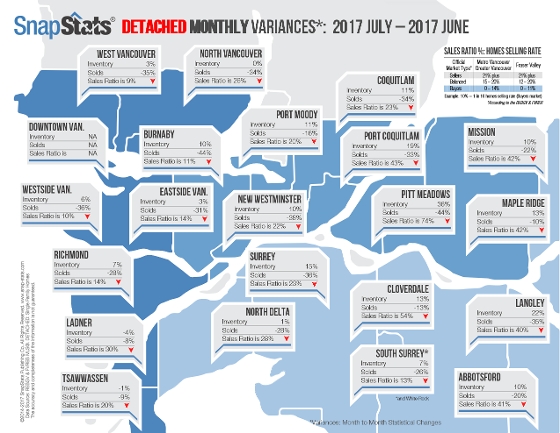
The market in Fairview is on fire!  It is consistently one of the best areas for sellers!

Stats for Oct, 2017

Sales ratio 67%

500k-600k 82%

800k-900k 1.5 million 73%


*Economists declare it is a sellers market at 20% and higher.  When the ratio exceeds 100% this means that the buying acitvity out paces the amount of homes being listed.

Read

The Surge in Metro Vancouver New Home Completions Housing affordability is fundamentally linked to the relationship between the housing stock and market demand. Strong economic growth has created rising labour demand and consumer confidence side effects, while net migration and a wave of millennials entering their household-forming years have rounded out a “perfect storm” of demand-side momentum. In turn, the supply of resale homes on the market in Metro Vancouver has plunged to decade lows. This has led to continuing upward pressure on home prices, because elevated consumer demand hasn’t been matched by an equivalent increase in supply.

BCREA

Read

BCREA ECONOMICS NOW

Canadian Inflation and Retail Sales - September 22, 2017

Canadian inflation, as measured by the Consumer Price Index (CPI), registered 1.4 per cent in the 12 months to August. That is a slight uptick from 1.2 per cent in July.   The Bank of Canada's three measures of trend inflation were also up slightly, averaging 1.5 per cent.   In BCprovincial consumer price inflation was 2.0 per cent in the 12 months to August.  

Canadian retail sales increased 0.4 per cent on a monthly basis in July and were 7.8 per cent higher year-over-year. Sales were higher in 6 of 11 retail sub-sectors with the main contribution coming from motor vehicle dealers and food and beverage storesIn BC, vigorous consumer spending continues to set the pace for the BC economy. Retail sales in the province climbed 0.7 per cent on a monthly basis and were up 12.3 per cent year-over-year.
 
Despite rapid economic growth in Canada, there is still very little sign of inflation. With inflation reading well below the Bank of Canada's 2 per cent target once again in August, the case for a further rate increase in October is lessened though not completely closed.

Read
Categories
The data relating to real estate on this website comes in part from the MLS® Reciprocity program of either the Real Estate Board of Greater Vancouver (REBGV), the Fraser Valley Real Estate Board (FVREB) or the Chilliwack and District Real Estate Board (CADREB). Real estate listings held by participating real estate firms are marked with the MLS® logo and detailed information about the listing includes the name of the listing agent. This representation is based in whole or part on data generated by either the REBGV, the FVREB or the CADREB which assumes no responsibility for its accuracy. The materials contained on this page may not be reproduced without the express written consent of either the REBGV, the FVREB or the CADREB.